Overview Page
The Overview page answers one question: what is the current state of my data platform? It shows the most recent result for every entity, in every layer, on a single screen.
Use it as your starting point. When everything is green, you are done in ten seconds. When something is not, the Overview tells you where to look next.
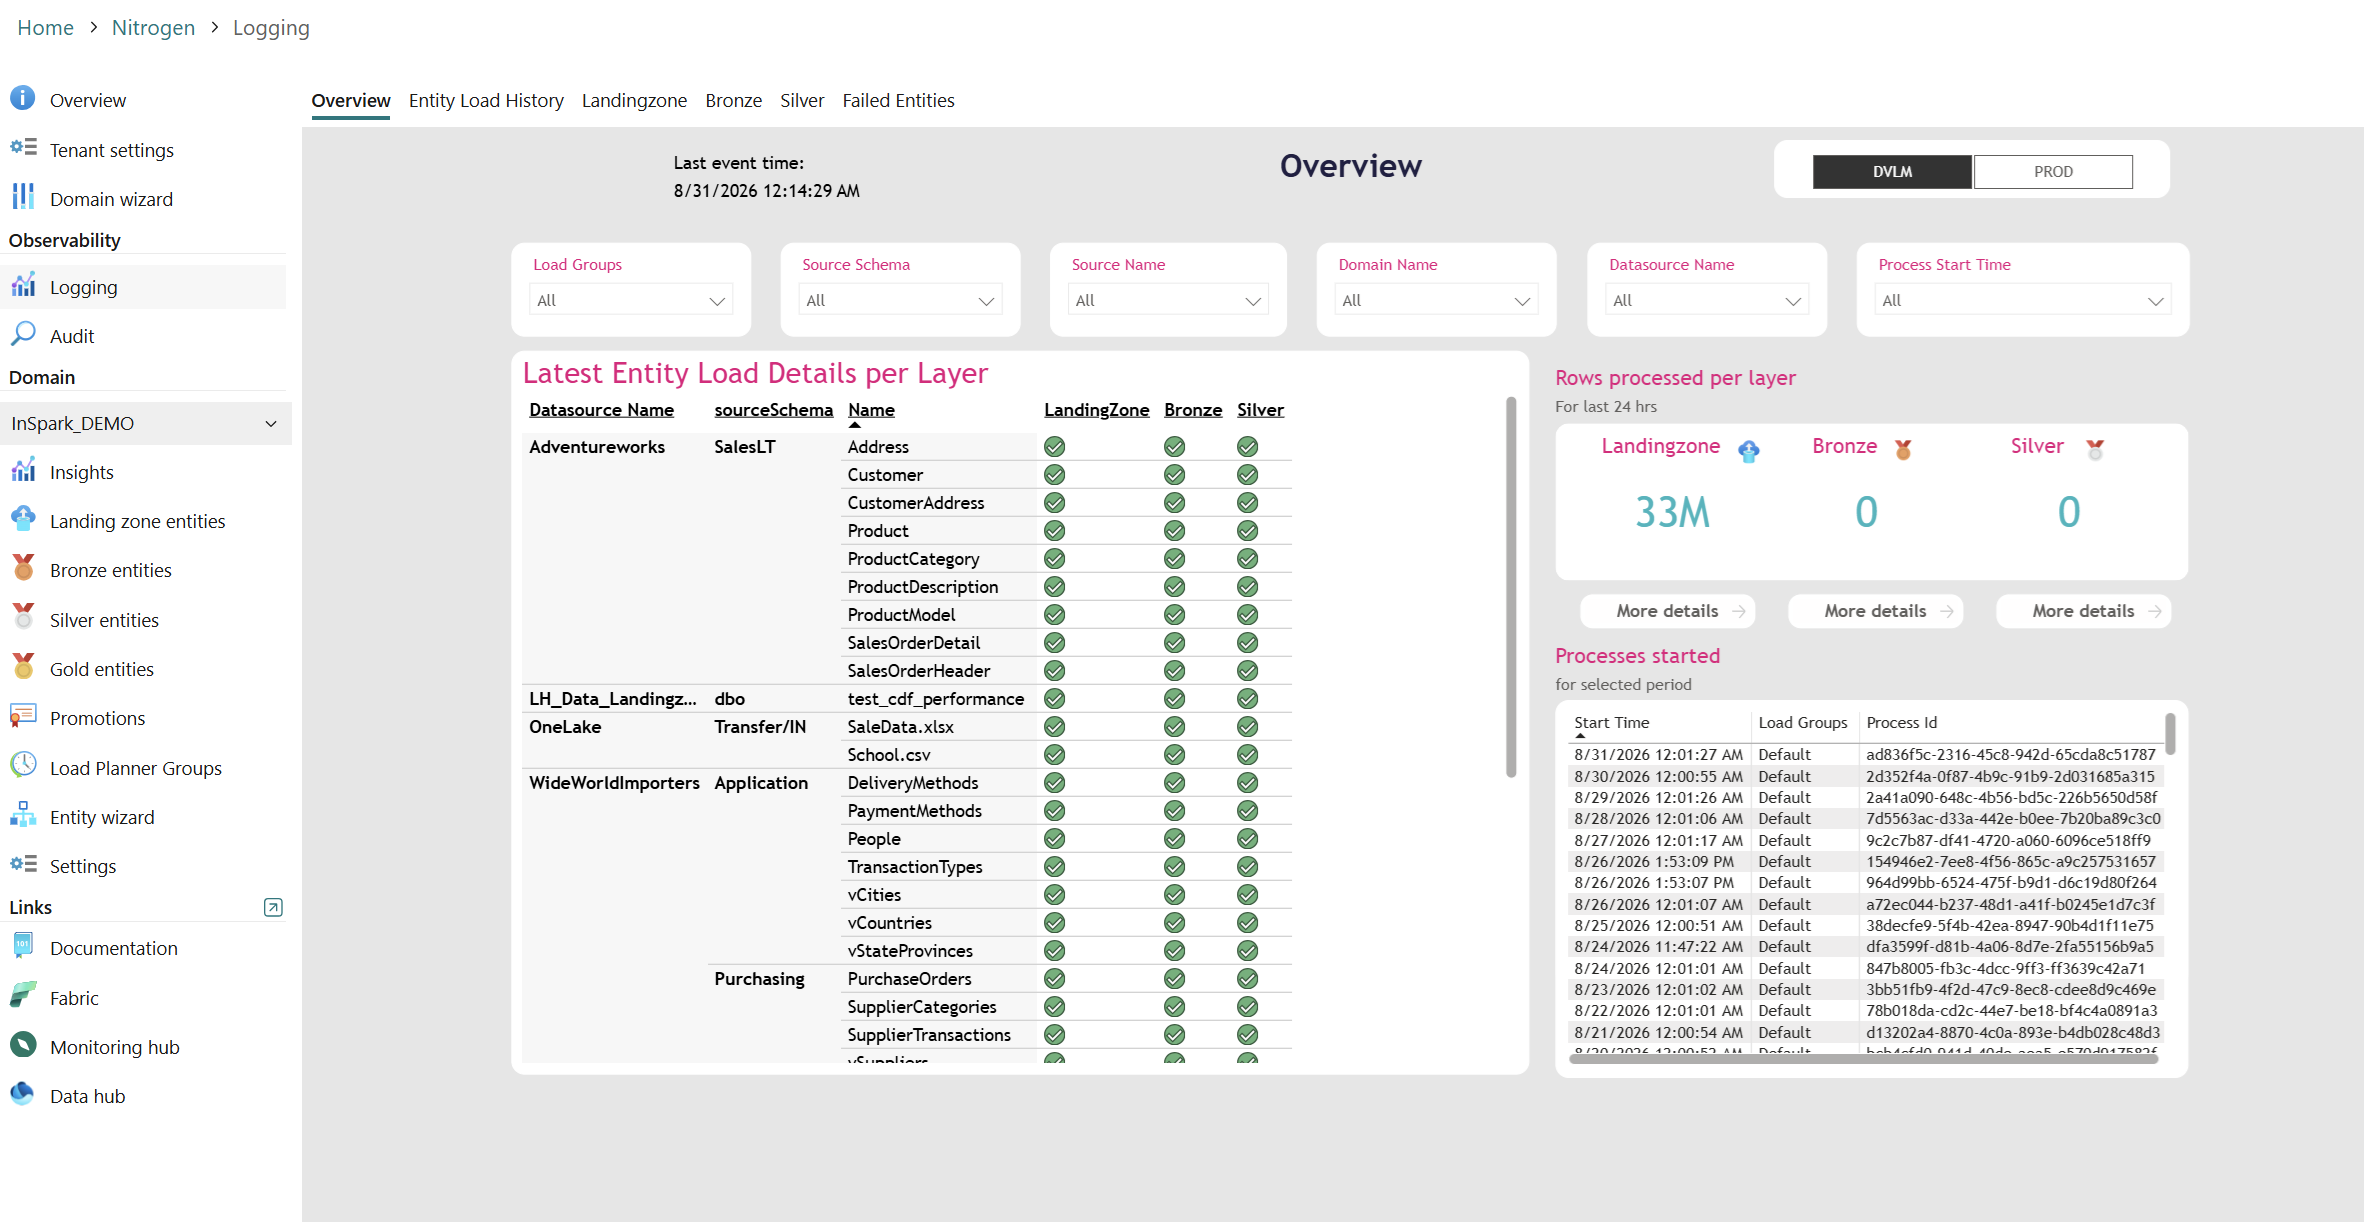
Latest Entity Load Details per Layer
The table on the left is the heart of the page. It lists every entity grouped by layer, data source, schema and name, and shows the latest known status for each one.
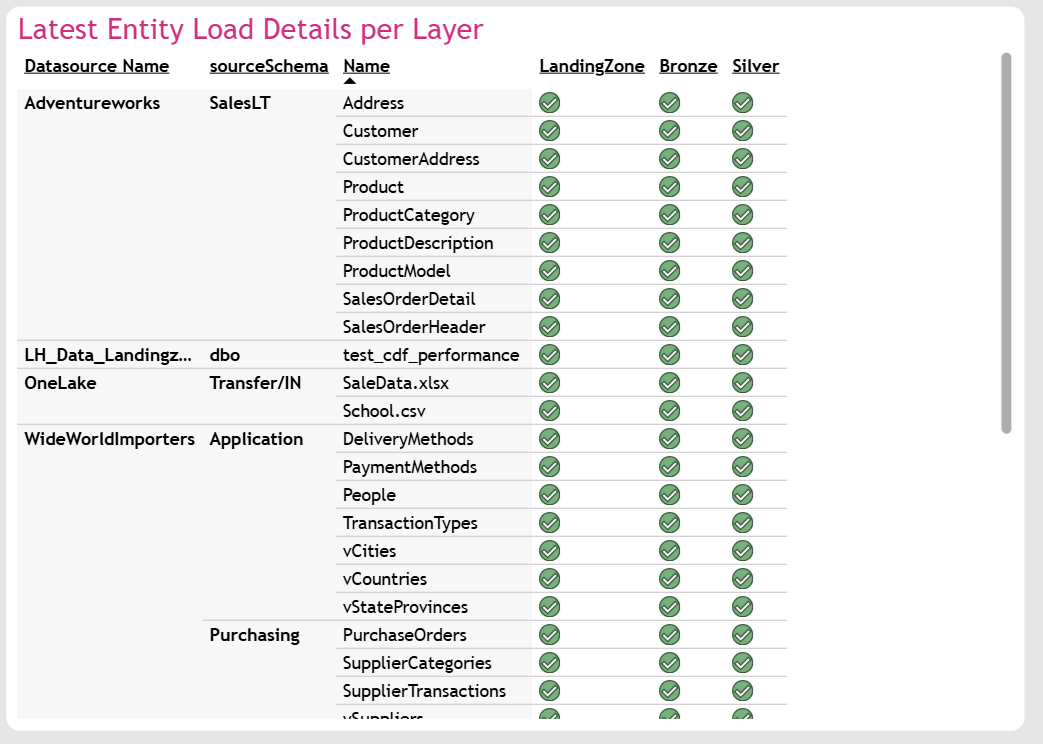
It is laid out as a matrix. The rows identify the entity, the columns are the layers, and each cell holds a status:
| Part of the matrix | What it shows |
|---|---|
| Rows: Datasource Name | The NCC data source the entity belongs to |
| Rows: Source Schema | The schema, folder or container of the entity |
| Rows: Name | The table, file or object name |
| Columns: Layer | LandingZone, Bronze and Silver, side by side |
| Cells: Status | ✅ succeeded, ⏳ started, ❌ failed |
Because the layers sit next to each other on one row, you can read an entity across the medallion in one glance: green in the Landing Zone but red in Bronze tells you the data arrived and the transformation is what broke.
Rows are collapsed by default. A data source shows the most severe status of everything underneath it, so a single ❌ makes the whole group red. Expand the group to find the entity responsible.
The hierarchy opens and closes the same way as on the Entity Load History page: the + and − buttons open one row, and right-clicking a row gives you Expand and Collapse with an All and an Entire level option. See Expanding and collapsing the hierarchy.
Latest result, not the selected period
This table always shows the most recent result for each entity, whenever it happened. It answers "what is the state right now?", not "what happened in the last 24 hours". For a periodic view, use the Entity Load History page.
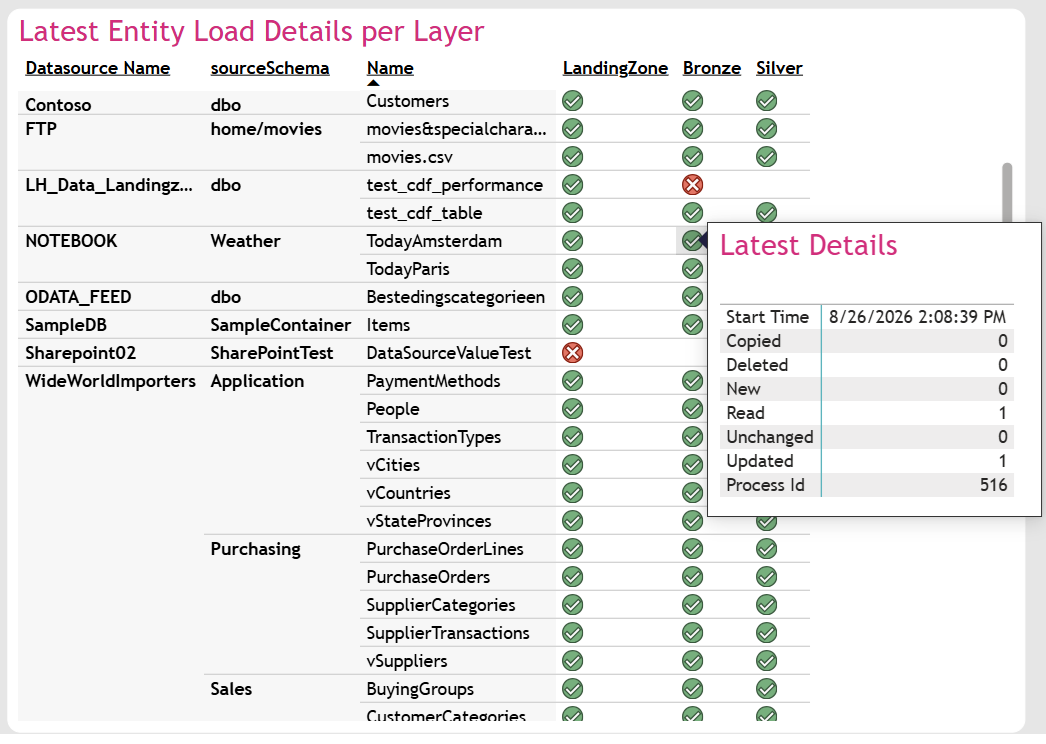
Hover for run detail
Hovering over a status shows a tooltip with the detail of that entity's latest run: when it started, how many rows were read, added, updated, deleted or unchanged, and the ID of the process that ran it.
Right-click to drill through
Right-click any entity row and choose Drill through to open a layer page already filtered to that entity, with its full run history, durations and links into Fabric.
The submenu offers Landingzone, Bronze and Silver and does not preselect one, so choose the layer of the row you clicked. The tooltip that opens with the menu names it. See From a red cell to the run details for the full walkthrough.
Rows processed per layer
The three cards at the top-right show how many rows were read in the selected period, per layer.
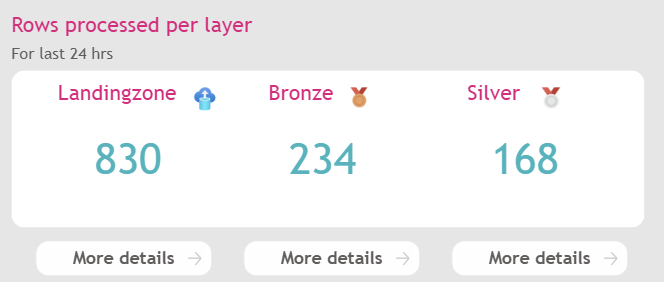
They are useful as a sanity check rather than an exact accounting figure. A layer that normally processes millions of rows and today shows a few thousand is worth a look, even when every status is green.
Each card has a More details button that opens the corresponding Landingzone, Bronze or Silver page.
Processes started
The table at the bottom-right lists the load processes that were triggered in the selected period.
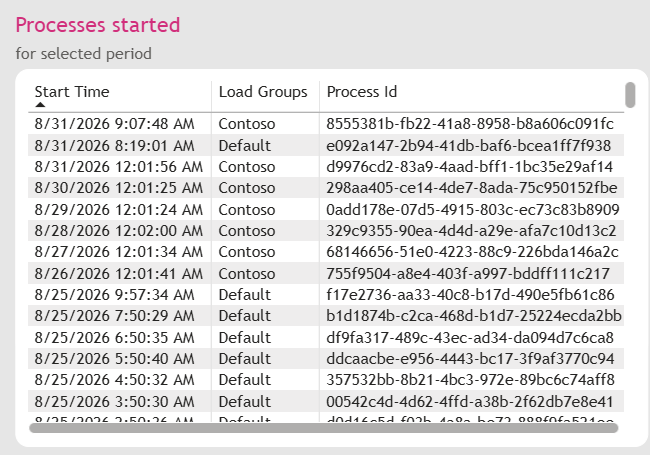
| Column | What it shows |
|---|---|
| Start Time | When the process started |
| Load Groups | The Load Planner Group or groups that were loaded |
| Process Id | The unique identifier of the run, used to correlate the run across layers and in Fabric |
Filters on this page
Load Groups, Source Schema, Source Name, Domain Name, Datasource Name, Process Start Time and the environment switch. See Reading the Logging Report for what each one does.
Next steps
- Entity Load History page — the same entities, but day by day.
- Failed Entities page — go straight to what went wrong.