Track Configuration Changes with the Audit Report
The Audit report is the second half of Observability in the NCC Portal. Where Logging tells you how your data loads are running, Audit tells you who changed what in the configuration behind them.
It answers the question that comes up whenever something behaves differently from yesterday: what did we change?
What problem does it solve?
An NCC platform is rarely managed by one person. Entities are added, data sources are reconnected, Load Planner Groups are reorganised, settings are adjusted — often by several people across development and production.
When a load suddenly behaves differently, the cause is frequently a change rather than a failure. The Audit report gives you one chronological record of every change made to your NCC configuration, so you can line up "this stopped working on Tuesday" with "this was changed on Tuesday".
Typical uses:
- An entity stopped loading — was it changed or removed, and by whom?
- A Load Planner Group no longer contains what you expect — when was it edited?
- Something was deleted; who did it and when?
- What did we change in the run-up to this release?
- How much configuration work happened last month, and by how many people?
Open the Audit report
- Open the Cloud Management Portal.
- In the left-hand menu, under Observability, select Audit.
The report is one page. You see only the changes made within your own tenant.
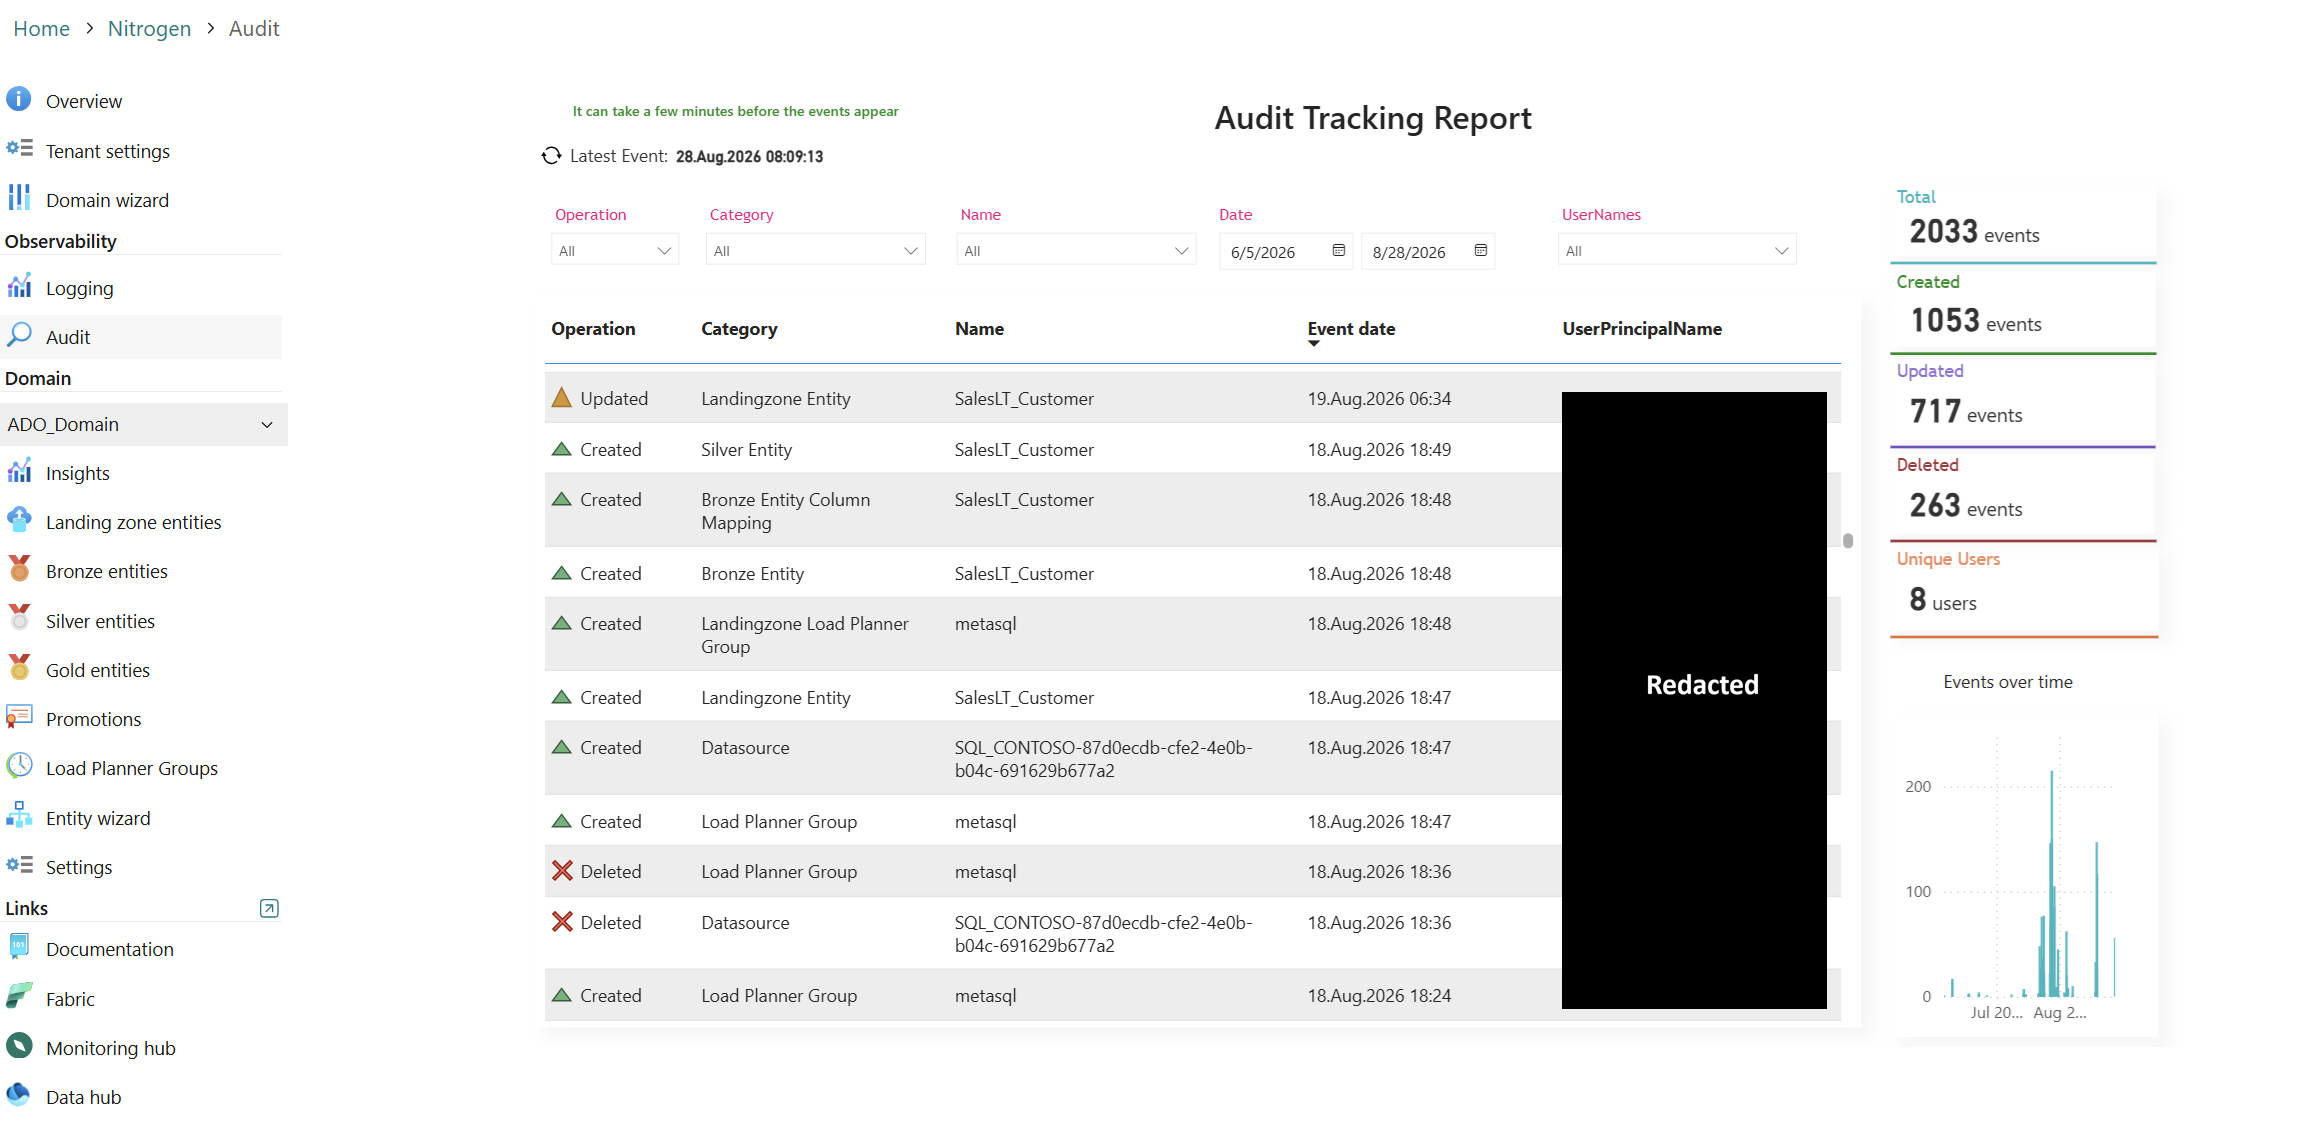
How to read the report
The header
Latest Event shows the moment of the most recent change the report knows about. Use it the same way you use Last event time in the Logging Report: it tells you how current the page is.
A change does not appear the instant you make it. As the note at the top of the page says, it can take a few minutes before events become visible. If you have just made a change and cannot find it, wait a moment and refresh.
The filters
| Filter | Filters on |
|---|---|
| Operation | Whether the record was created, updated or deleted |
| Category | The kind of object that changed — an entity, a data source, a Load Planner Group, and so on |
| Name | The name of the specific object that changed |
| Date | A start date and an end date. Unlike the Logging Report, this is a free range rather than a fixed period |
| UserNames | The person who made the change |
The two most useful combinations are Name on its own — the full history of one object — and Date plus UserNames, to reconstruct what a particular person did on a particular day.
The change list
The table in the middle is the report. Every line is one change, newest first.
| Column | What it shows |
|---|---|
| Operation | Created, Updated or Deleted |
| Category | The kind of object that changed |
| Name | The name of the object |
| Event date | When the change was made |
| UserPrincipalName | The account that made it |
Each operation has its own marker, so you can scan the list without reading every line:
| Marker | Operation | Meaning |
|---|---|---|
| Green triangle | Created | The object was added |
| Orange triangle | Updated | The object already existed and was changed |
| Red cross | Deleted | The object was removed |
A single action in the portal often produces several lines. Creating one entity through the Entity Wizard, for example, creates the Landing Zone, Bronze and Silver records and their column mappings — each of which is its own line, within the same few seconds. That is normal: read a burst of entries at the same timestamp as one piece of work.
The summary cards
Down the right-hand side, for whatever the filters currently select:
| Card | What it counts |
|---|---|
| Total | All changes |
| Created | New objects |
| Updated | Changes to existing objects |
| Deleted | Removals |
| Unique Users | How many different people made those changes |
They follow the filters, so they are a quick way to size up a period: set the Date range to last month and you have that month's configuration activity at a glance.
Events over time
The chart at the bottom right plots changes over time. Use it to spot bursts of activity — a release, a migration, a bulk edit — and then set the Date filter to that moment to see what happened.
What is recorded
The report covers the configuration objects NCC manages for you. The Category filter lists them:
| Bronze Entity | Landingzone Entity |
| Bronze Entity Column Mapping | Landingzone Entity Values |
| Bronze Entity Values | Landingzone Load Planner Group |
| Configuratie | Load Planner Group |
| Datasource | Notebook |
| Domain | Pipeline |
| Environment | Silver Entity |
| Gold Entity | TenantSettings |
| Gold Load Planner Group | Workspace |
| Lakehouse |
This spans both the modelling side of NCC — entities, their values and column mappings, data sources, Load Planner Groups — and the platform objects that belong to a domain, such as workspaces, lakehouses, pipelines and notebooks.
Common scenarios
When did this entity last change?
- Set Name to the entity.
- Clear the Date range, or widen it to cover the period you are interested in.
- Read the list from the top: the most recent change to that entity is the first line.
Who deleted this?
- Set Operation to Deleted.
- Set Category to the kind of object, or Name if you know it.
- The UserPrincipalName and Event date of the remaining lines tell you who and when.
What changed around the time something broke?
- Open the Logging Report and note when the load first failed or stopped.
- In Audit, set the Date range to the day before and the day of that moment.
- Work through the list. Changes to the entity itself, to its data source or to its Load Planner Group are the first candidates.
Limitations
You see that something changed, not what changed
This is the most important limitation to be aware of. For an Updated entry the report tells you which object was changed, when, and by whom — but not which field was changed, nor what the value was before and after.
So Audit tells you where to look and who to ask. To find out what the change actually was, open the object in the portal, or ask the person named in UserPrincipalName.
For Created and Deleted entries this matters less, since the operation itself is the whole story.
One action can produce many entries
Because a single action in the portal can touch several underlying objects, the number of entries is not the number of things you did. Treat the counts on the cards as a measure of activity rather than an exact count of user actions.
Changes take a few minutes to appear
The report is close to real time but not instant. Check Latest Event before concluding that a change was not recorded.
Related
- Logging — how your data loads are running.
- Limitations of the Logging Report
- Authorization Matrix
- Observability overview — the general introduction to Observability.