Entity Load History Page
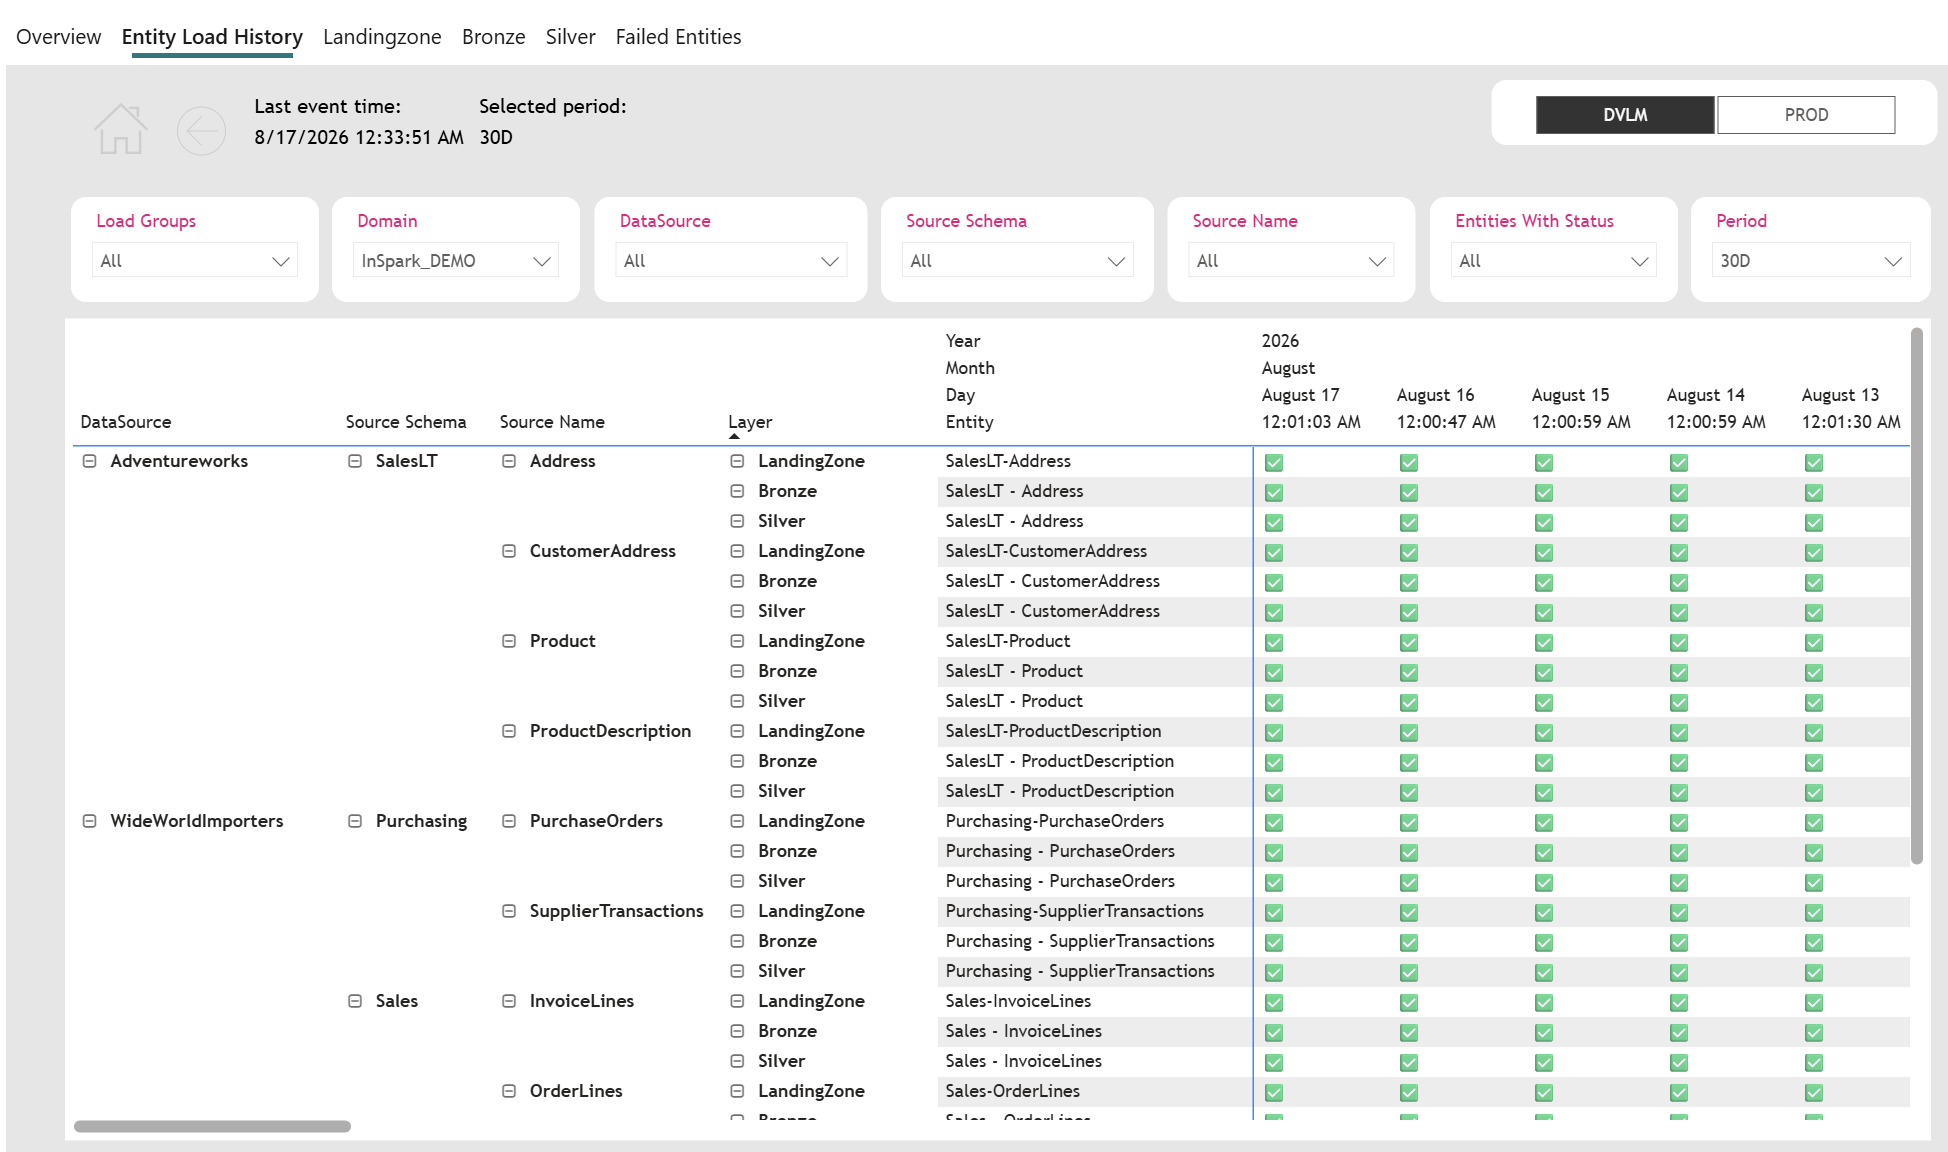
Where the Overview shows the state of your platform right now, the Entity Load History page shows it over time. Every entity is a row, every load is a column, and every cell is a status icon.
This is the page to use when you want to know whether an entity has been loading reliably, when it stopped, or whether a failure this morning is an incident or a pattern.
How to read the matrix
Rows describe what was loaded, from broad to specific:
| Level | Example |
|---|---|
| DataSource | Adventureworks |
| Source Schema | SalesLT |
| Source Name | Address |
| Layer | LandingZone, Bronze, Silver |
| Entity Name (of that layer) | SalesLT - Address |
Columns describe when: Year, Month, Day and Run — the exact moment the load process started. The most recent load is on the left, so the result of today is always the first column you see.
Cells contain the status of that entity in that run:

| Icon | Meaning |
|---|---|
| ✅ | The entity loaded successfully in that run |
| ⏳ | The load started but has not reported an end — in progress, or ended without being able to report |
| ❌ | The load failed |
| (empty cell) | The entity was not loaded in that run |
Empty cells are the point of this page
An empty cell is not the same as a green one. Reading across a row and spotting where the checks stop is the fastest way to find an entity that quietly dropped out of a load — something a status-only view will never show you, because there is no failure to report.
Expanding and collapsing the hierarchy
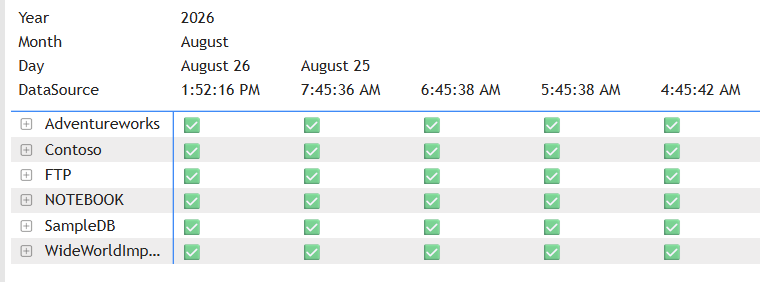
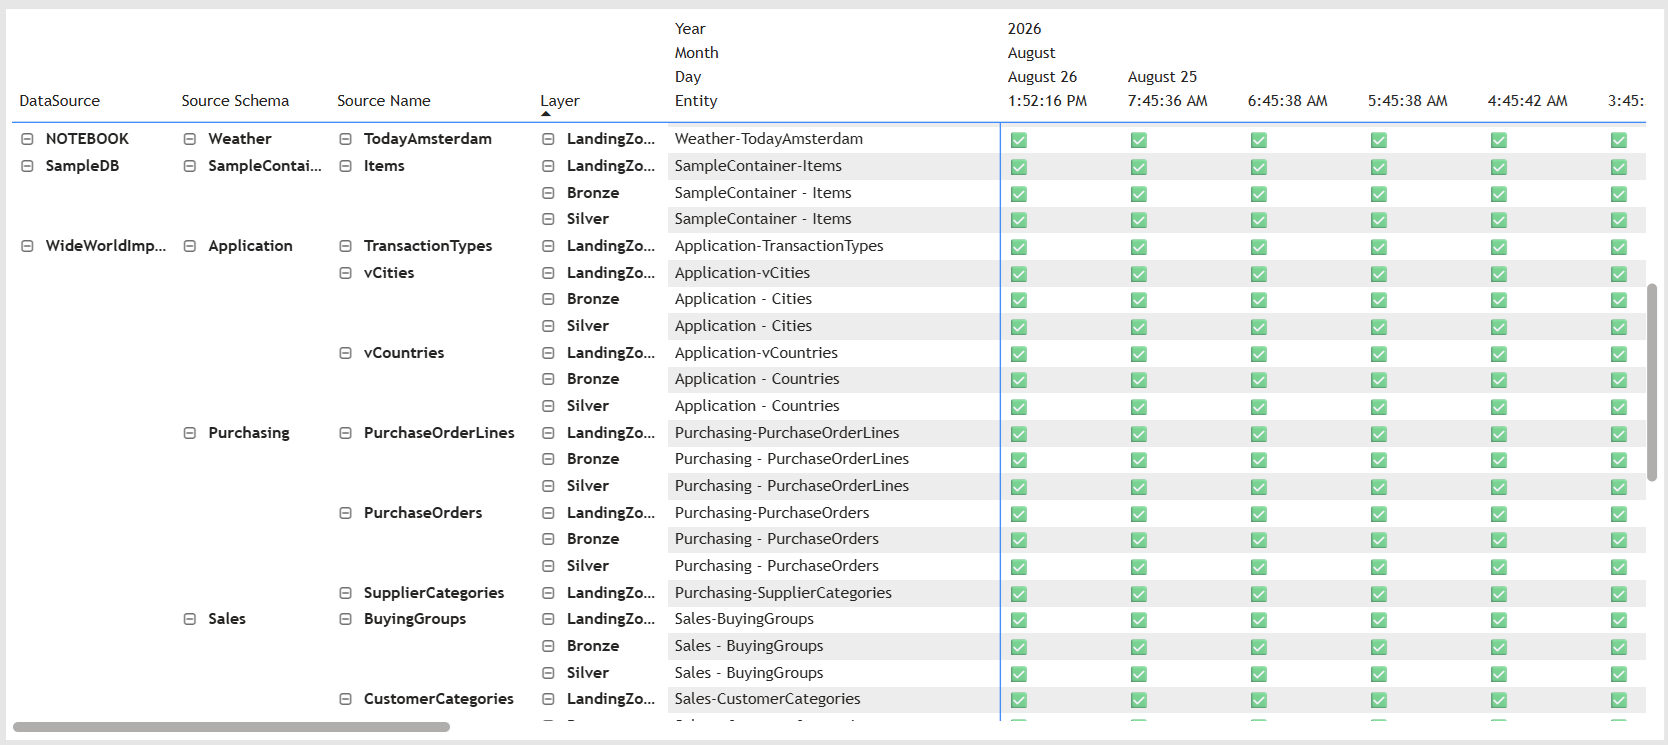
The five row levels — DataSource, Source Schema, Source Name, Layer, Entity — are one hierarchy that you open and close as you work. Collapsed rows roll up the most severe status underneath them, so a single ❌ deep in a data source turns its top-level row red.
That makes the natural way to work: start collapsed, scan for red, then expand only where you need to.
Collapsed to data source level, the whole platform fits on one screen:
Expanded all the way down, you see each layer of each entity separately:
Moving between the two
| To do this | Use |
|---|---|
| Open or close one row | The + and − buttons in front of the row |
| Open one row all the way down to its entities and layers | Right-click the row and choose Expand > All |
| Open every row at the same level at once | Right-click any row and choose Expand > Entire level |
| Go back up one level for every row | Right-click any row and choose Collapse > Entire level |
| Return to the collapsed data source view | Right-click any row and choose Collapse > All |
Tip
Use Expand > All on a single data source rather than on the whole matrix. Expanding everything at once produces hundreds of rows and you lose the overview that makes this page useful.
From a red cell to the run details
A ❌ tells you that an entity failed. The run itself — its duration, its row counts and the link into Microsoft Fabric where the error message lives — sits on the layer page for that entity. Drill through takes you there.
- Right-click or over over the cell you want to investigate. A tooltip appears with the full context of that cell: data source, source schema, source name, layer, entity, the run it belongs to, and its status.
- Choose Drill through. The submenu lists the three layer pages: Landingzone, Bronze and Silver.
- Select the layer that matches the Layer value in the tooltip.
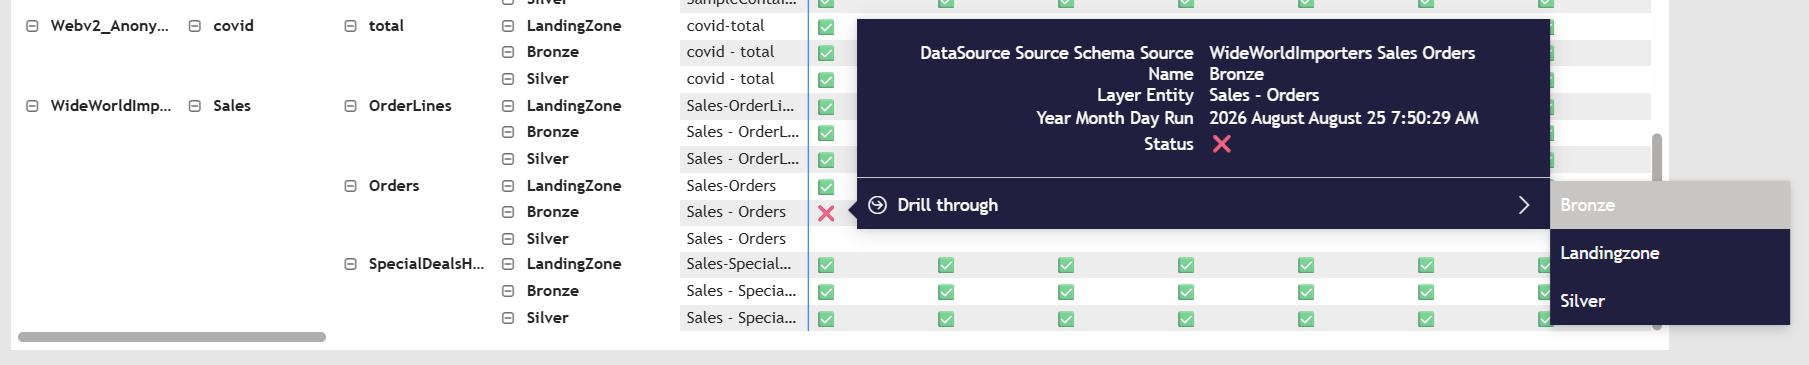
Choose the layer of the row you clicked
The menu always offers all three layers and does not preselect the right one. Right-clicking a Bronze row and choosing Landingzone takes you to the Landing Zone page for that entity — a different activity, with its own status, which may well be green while the Bronze load is the one that failed.
The tooltip that opens with the menu shows the Layer of the cell you clicked. Read it, then pick the matching target.
The report jumps to that layer page, filtered to the entity you clicked. In its detail table you find the failed run and follow the link in the Monitoring URL column into Microsoft Fabric. If the failure came from a notebook, that link opens the parallel main notebook rather than the entity notebook, so there are two more steps to the error message — see From a failure to its cause.
The run you clicked does not travel with you
Drill-through passes the entity context — data source, schema, name and layer — but not the moment of the run. The layer page opens on its own Period filter, which starts at the last 24 hours. If the failure you clicked is older than that, widen Period on the layer page until the run appears.
Older than 30 days and the trail stops here
Fabric keeps run detail for 30 days. Beyond that the matrix still shows the ❌, because the report keeps about 90 days of history, but the Monitoring URL leads nowhere. This is the page where that boundary is easiest to cross without noticing: at 30D and YTD you are routinely looking at loads whose runs Fabric has already discarded.
See Landingzone, Bronze and Silver pages for what the detail tables show, and Failed Entities for working through several failures at once.
Filters on this page

This page carries the full filter bar: Load Groups, Domain, DataSource, Source Schema, Source Name, Entities With Status and Period. It has no Reset to 24H Default button — that one is only on the layer pages.
Two of them do most of the work here:
- Period decides how far back the columns go. Start at 7D or 30D — with 24H you only get one or two columns, which defeats the purpose of the page.
- Entities With Status narrows the matrix to entities that had a particular status in the period. Select Failed to hide everything that stayed healthy and leave only the rows that need attention.
How Entities With Status selects rows
This filter looks at the whole period, not at the latest result. An entity is kept as soon as the selected status occurred at least once in the loads shown on screen.
So when you filter on Failed over a period of 30 days:
- An entity that failed three runs ago and has succeeded in the two runs since is still listed. It failed somewhere in the period, so it qualifies.
- Its row still shows its real results: one ❌ for the run that failed, and ✅ for the runs that succeeded afterwards.
The filter decides which rows appear. It never changes the icons inside a row.
Reading a filtered list
Because the list is "everything that failed at some point", it is a history of incidents rather than a list of problems that are still open. The leftmost column tells the two apart: a ❌ in the most recent run is still broken, a ❌ followed by ✅ recovered on its own.
Narrowing Period narrows the filter with it. Switch to 24H to see only what failed in the most recent loads.
Typical uses
Did this entity load every day this week? Set Period to 7D, filter on the entity with Source Name, and read the row from left to right.
Which entities have stopped loading? Set Period to 30D and scan for rows where recent columns are empty but older ones are green.
Is this failure new? Find the ❌, then look at the columns to its right. A row of green followed by one red is an incident; alternating red and green points at an unreliable source or a timing problem.
Next steps
- Landingzone, Bronze and Silver pages — run-level detail for a single layer.
- Common monitoring scenarios