Failed Entities Page
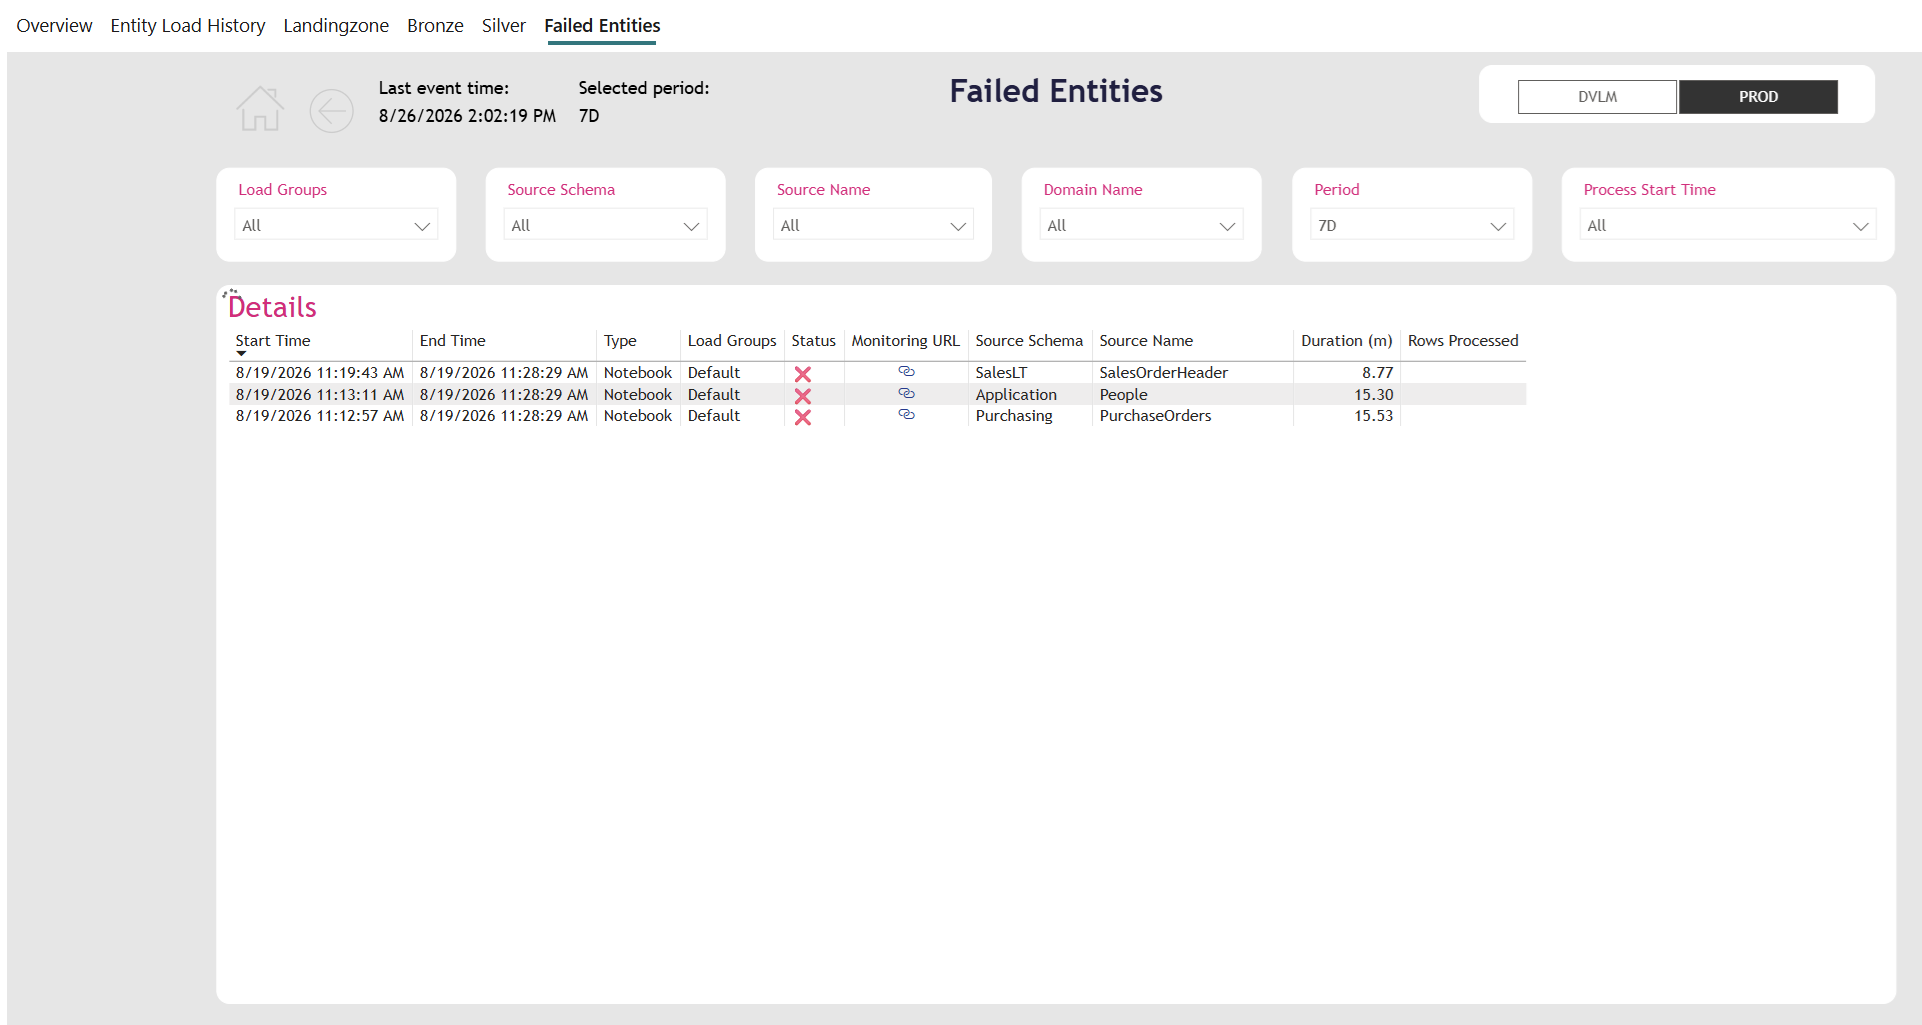
The Failed Entities page is a worklist. It shows every entity that failed in the selected period, across all layers, with a link to the error in Microsoft Fabric next to each one.
Open it after a load to check whether anything needs attention, or go straight to it when someone reports that data is missing.
What is on the page
One table, filtered to failures only. Every row is one activity that reported a failure for one entity in one layer.
| Column | Meaning |
|---|---|
| Start Time / End Time | When the failed activity started and stopped |
| Type | Whether the failure came from a copy activity or from a notebook. This decides how you get to the error |
| Load Groups | The Load Planner Group that triggered the load |
| Status | ❌ — this page shows failures only |
| Monitoring URL | Link to this exact run in the Fabric monitoring hub |
| Source Schema / Source Name | The entity that failed |
| Duration (m) | How long the activity ran before it failed |
| Rows Processed | Rows processed before the failure, if any |
Entity-level failures only
This page deliberately leaves out the orchestrating pipeline itself. If a pipeline fails because one entity inside it failed, you see the entity — not a second row for the pipeline. That keeps the list to items you can act on.
An empty table is good news: nothing failed in the selected period.
From a failure to its cause
The report records that something failed. The error message itself lives in Microsoft Fabric, one click away.
The error is only there for 30 days
Fabric keeps run detail for 30 days, while the report keeps its own history for about 90. A failure older than that still shows as ❌ here, but its Monitoring URL no longer opens anything and the error message is gone for good. Work through failures while they are recent.
- Find the failed entity in the table.
-
Select the link in the Monitoring URL column.

Where that link takes you depends on the Type column, so the last few steps differ per item type. Bronze and Silver are always notebooks; the Landing Zone can be either, so read the column rather than assuming from the layer.
Copy activity failures
The link opens the pipeline run that contains the copy activity. Open the failed activity to read the error message and the full run detail.
These failures usually point at the source system or the connection: the source was unavailable, credentials expired, an object was renamed or removed, etc.
Notebook failures
NCC loads entities in parallel, so an entity notebook is never started on its own: it is always invoked from a parallel main notebook that orchestrates the batch. This holds for every notebook-loaded entity, in the Landing Zone as well as in Bronze and Silver. The monitoring link therefore opens that parallel main run, not the notebook of the entity you clicked.
From there, two more steps get you to the actual error:
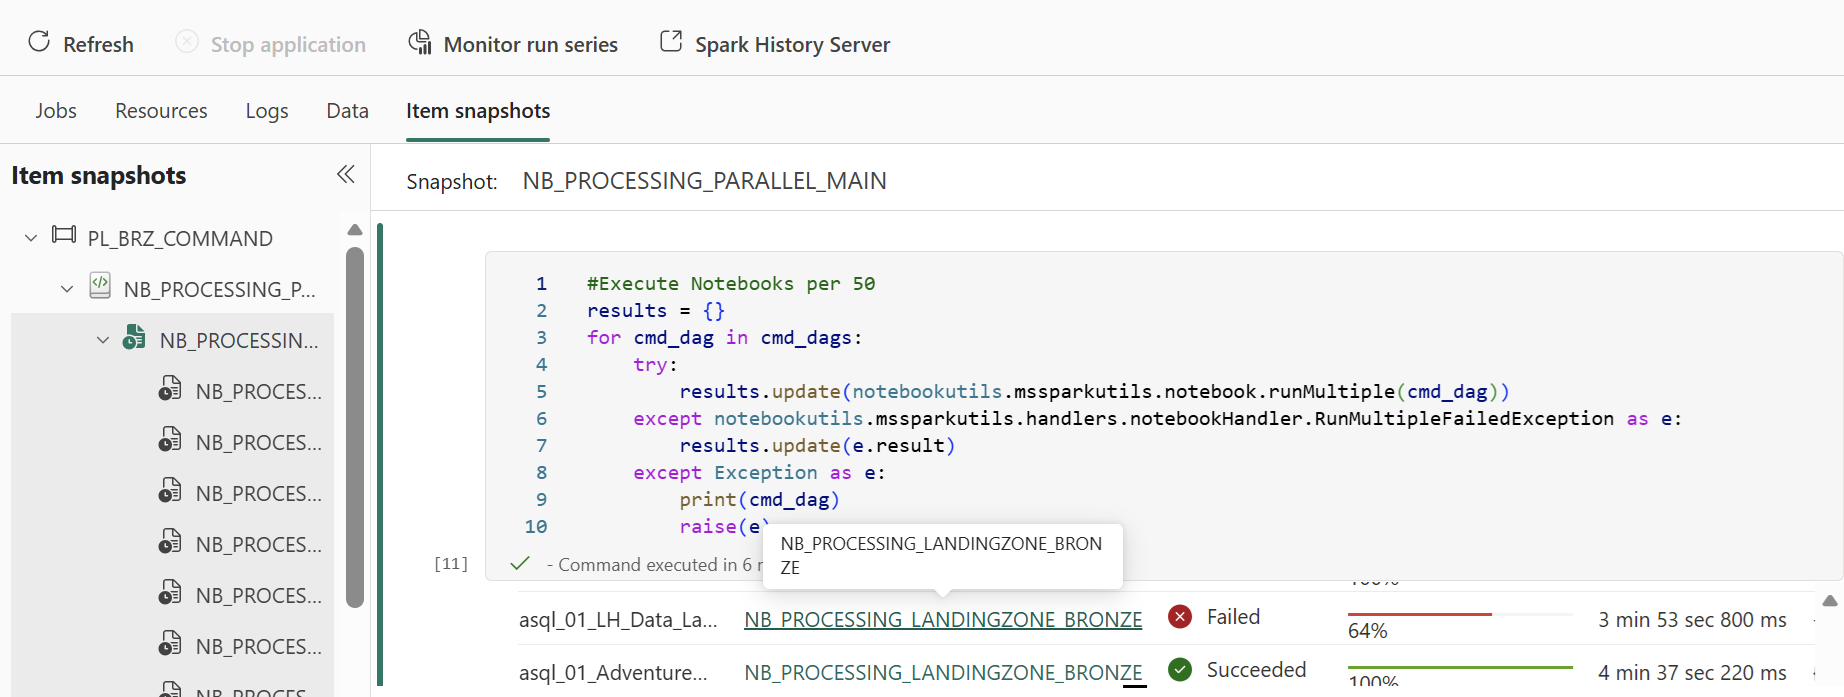
- In the parallel main run, open the Item snapshots tab and go to the cell that executes the DAGs — the cell that calls
runMultiple. Its output lists every entity notebook the run started, with a status, a progress bar and a duration for each. - In that output, find the row with the ❌ Failed status and select the notebook name next to it. That opens the run of the notebook that actually failed, where the error message and the Spark logs are.
Tip
The output of the DAG cell is the fastest overview of one run: it shows every entity notebook, its status, its progress and its duration side by side. When several entities failed in the same run, you can work through all of them from this one list instead of returning to the report each time.
Whichever route you took, work from the earliest failure forward. A Silver entity often fails only because its Bronze entity failed first, so fixing the earliest failure in the chain frequently clears the rest.
Once you know the error, Common Errors and Solutions covers the messages that come up most often.
Working through a set of failures
- Set Period to match the load you are investigating — 24H for last night, 7D to see whether the same entity keeps failing.
- Filter on Load Groups to isolate one scheduled load.
- Filter on Source Schema or Source Name to narrow to one group of entities. When a whole source system is unavailable, a long list of failures with the same schema usually has a single cause.
Checking a failure in context
The Failed Entities page tells you what failed now. To see whether it also failed yesterday, switch to Entity Load History, filter on the same entity and read the row: a single ❌ in a line of ✅ is an incident, a repeating pattern is a structural problem.