Landingzone, Bronze and Silver Pages
The report has one page per medallion layer. They share the same layout and are filtered to their own layer, so you can compare like with like as data moves from the Landing Zone through Bronze into Silver.
Use these pages when you already know where to look and now want the detail: how long a load took, how many rows it moved, and a direct link into Microsoft Fabric.
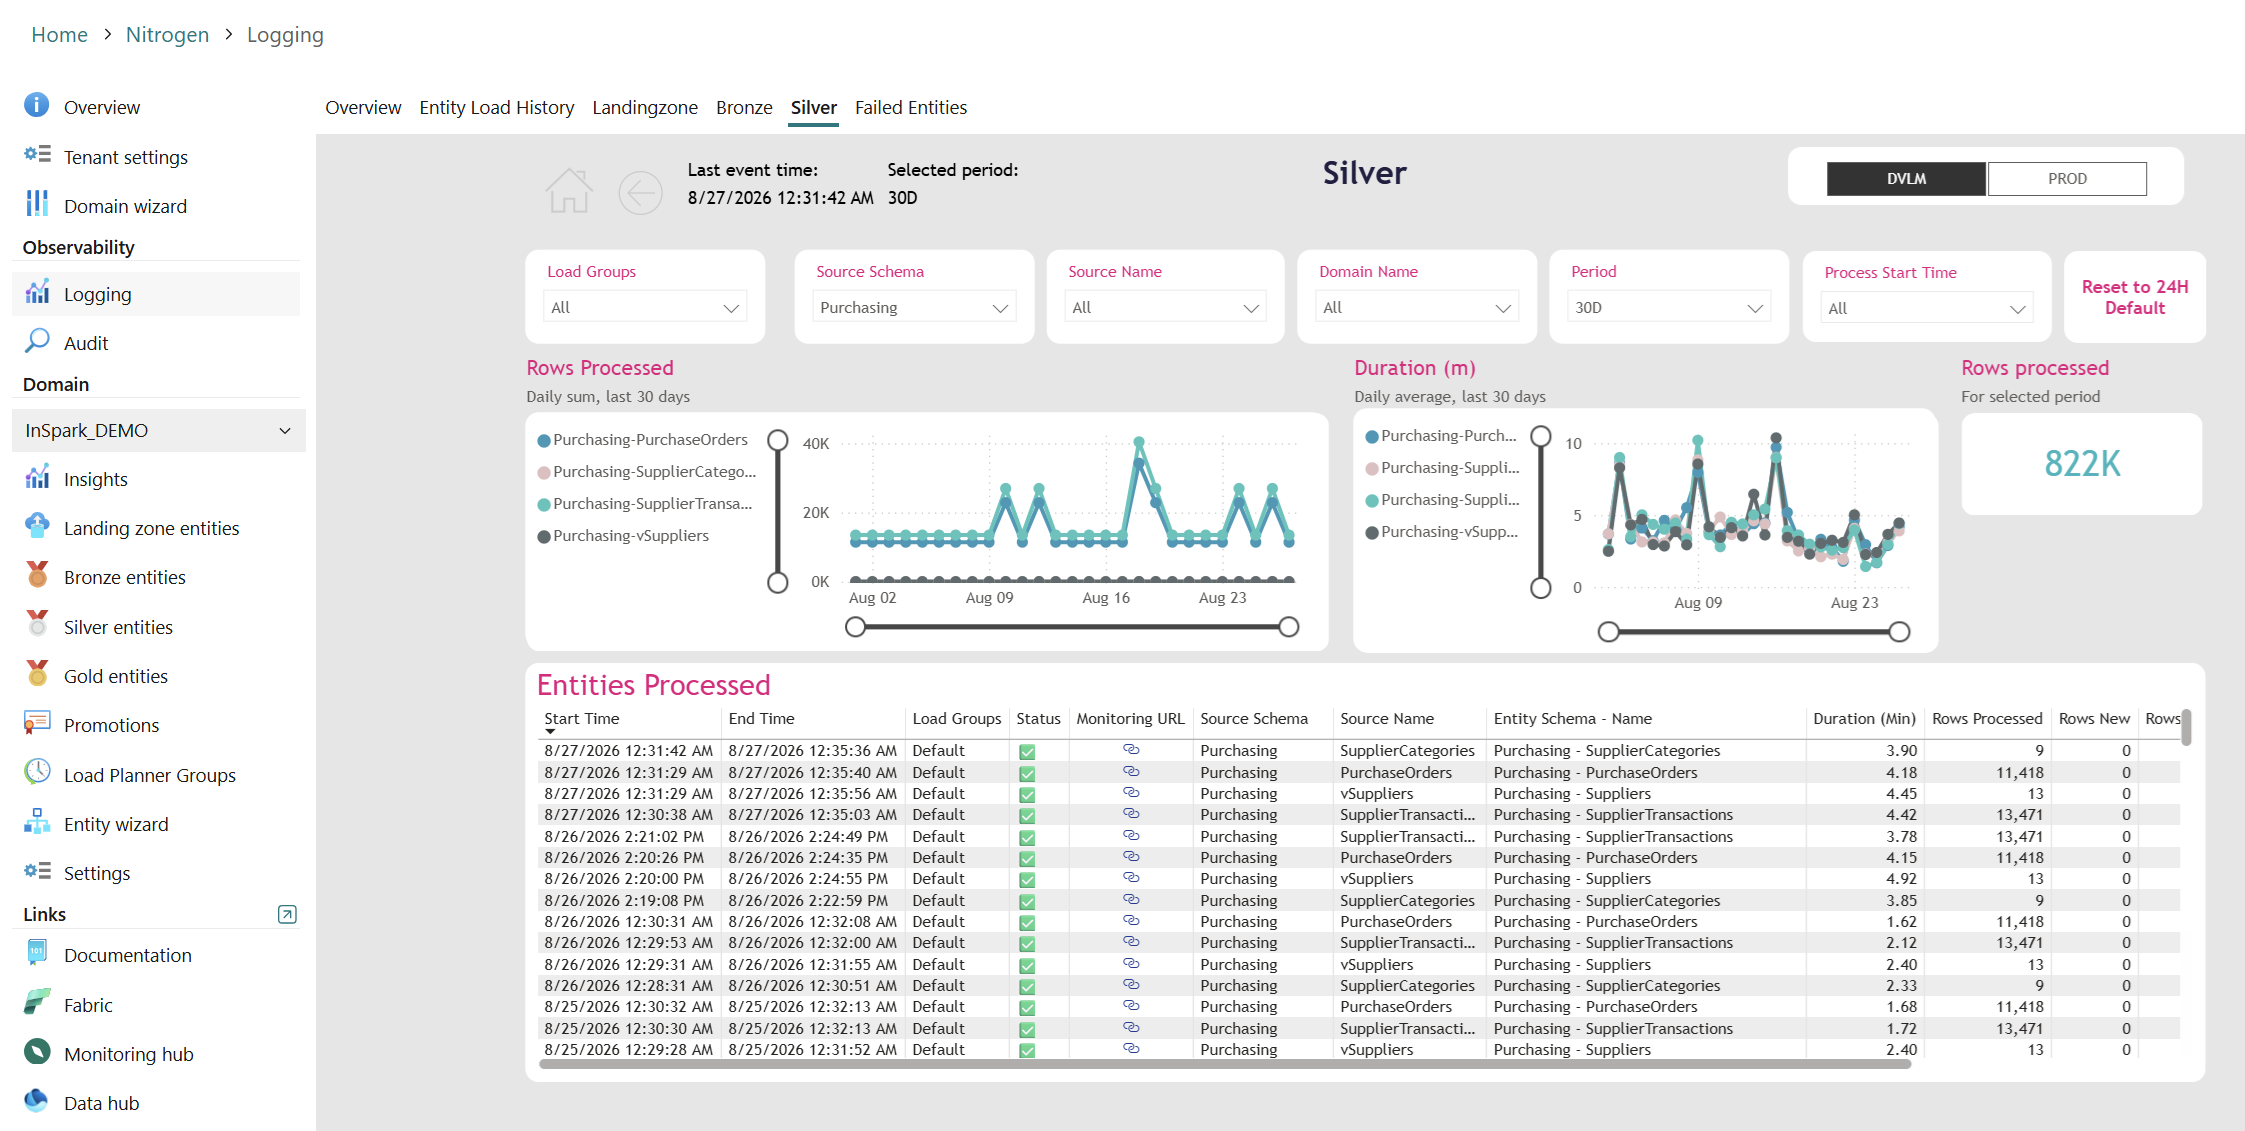
The shared layout
Each layer page has three bands.
1. Filters
Load Groups, Source Schema, Source Name, Domain Name, Period and Process Start Time, plus a Reset to 24H Default button at the end of the bar.
Reset always returns you to Production
Reset to 24H Default clears every filter, sets Period back to 24H and switches the environment back to PROD. If you were looking at a development environment, you are now on production. Check the environment switch in the header after a reset.
2. Trend charts
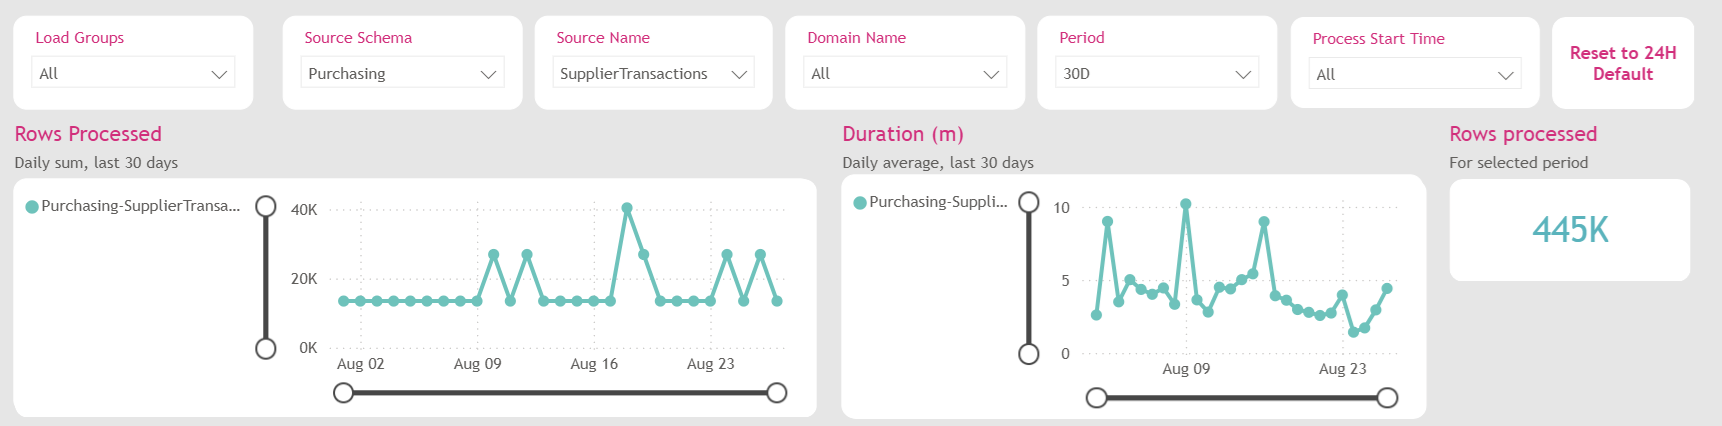
| Visual | What it shows |
|---|---|
| Rows processed (card) | Total rows processed in the selected period for this layer |
| Rows processed (line chart) | Rows processed per day over the last 30 days, one line per entity |
| Duration (m) (line chart) | Average run duration in minutes per day over the last 30 days, one line per entity |
The charts always cover 30 days regardless of the Period filter, so you can see a single run in context. A line that climbs steadily is the earliest warning you get that a load is growing towards its time window; a sudden drop in rows is worth checking even when the status is green.
3. Detail table
The table at the bottom lists the individual activities. Its columns are described under each layer below.
Landingzone
The Landing Zone is where data first arrives from your source systems. Depending on the data source, an entity is brought in either by a copy activity or by a notebook — sources such as PySpark and Python notebooks, and any custom notebook you add yourself, run as notebooks. The detail table lists one row per activity, and the Type column tells you which of the two it was.
| Column | Meaning |
|---|---|
| Start Time / End Time | When the activity started and finished |
| Type | Whether a copy activity or a notebook loaded the entity |
| Load Groups | The Load Planner Group that triggered the load |
| Status | ✅ succeeded, ⏳ started, ❌ failed |
| Monitoring URL | Link to this exact run in the Fabric monitoring hub |
| Source Schema / Source Name | The entity that was loaded |
| Duration (m) | Run time in minutes |
| Rows Processed | Rows retrieved from the source |
File-based entities show 0 rows
Some Landing Zone entities are files that are taken from the source and stored as they are — a CSV, a Parquet file, a document. Nothing reads through them line by line, so Rows Processed shows 0. That is normal for a file and does not mean the load was empty. Judge those entities on their Status and Duration instead.
Why this table has no new/updated/deleted counts
A copy activity moves data as-is into the Landing Zone and does not compare it against what is already there, so it reports no row-level change counts. Because the Landing Zone mixes copy activities and notebooks, this page leaves those columns out altogether; the full set is on the Bronze and Silver pages below.
Bronze and Silver
Bronze and Silver are built by notebooks, which compare incoming data with what is already stored. Their detail tables therefore carry the full set of row counts.
Entities Processed
One row per entity that was processed in this layer.
| Column | Meaning |
|---|---|
| Start Time / End Time | When the load of the entity started and finished |
| Load Groups | The Load Planner Group that triggered the load |
| Status | ✅ succeeded, ⏳ started, ❌ failed |
| Monitoring URL | Link to this notebook run in Fabric |
| Source Schema / Source Name | The source entity |
| Entity Schema - Name | The name of the entity in this layer |
| Duration (Min) | Run time in minutes |
| Rows Processed | Rows offered to this layer |
| Rows New | Rows inserted |
| Rows Updated | Rows that changed |
| Rows Deleted | Rows marked as deleted |
| Rows Unchanged | Rows that were identical to what was already stored |
Reading the row counts
On a healthy incremental load, Rows Unchanged is usually the largest number and Rows New plus Rows Updated is small. A load where every row is suddenly new often means the source was reloaded in full or a key changed — worth checking before it reaches your reports.
Arriving here from another page
Right-clicking an entity on the Entity Load History page and choosing Drill through opens the layer page already filtered to that entity. The filter bar reflects the filters that came with you; use Reset to 24H Default to clear them and see the whole layer again — remembering that it also puts you back on Production.