PowerBI
Power BI Guidelines for Customer Solutions
This article provides best practices for designing Power BI datasets and reports, following Microsoft Learn Fabric documentation style.
Source Data
The source for datasets is the Warehouse views/tables from the Dm<Domain> schema in the datastore database.
- The connection to the datastore database is parameterized using the
Connectionstringparameter. This enables cross-environment deployments via DevOps pipelines. Configure this per table in the Power Query Advanced Editor. - Use the
LimitDataparameter to control dataset size: GIT: Check-in datasets without data.Develop: Develop with limited data for improved performance.Full: Publish datasets with all data via DevOps pipelines.
Data Model
Model datasets using a star schema.
- Set relationship cardinality to one-to-many from dimension to fact tables.
- Set relationship filter direction to single from dimension to fact tables.
Dimensions
- Use the integer key generated in the Stage Key layer as the primary key.
- Key fields are used only for relationships and hidden in report view (generated integer keys are not business-relevant).
- Set numeric fields' summarization property to Don't summarize.
- Use a single date dimension (
DimDate). For facts with multiple date fields, create inactive relationships withDimDateand use the DAX functionUSERELATIONSHIP. - Mark
DimDateas a date table to enable time intelligence functions.
Measures
- Prefer explicit measures to ensure consistency for business users.
- Add measures only to fact tables.
- Format DAX formulas with indentation for readability.
- Specify the data type (e.g., currency, percentage, decimal number).
- Include notation (e.g., %, #, €) in the measure name. Use the convention:
<unit> <measure name>. Examples: % Margin(#) Articles€ Revenue- Group measures in folders when there are many measures.
Additional Recommendations
- Separate datasets from reports to centralize administration. Reports connect to datasets published to Power BI Service via live connection.
- Disable the following settings:
- Auto date/time (Options > Data Load > Time Intelligence)
- Import relationships from data sources on first load
- Update or delete relationships when refreshing data
- Autodetect new relationships after data is loaded
- Add a table to the model that includes last load dates for each table. Display these dates in reports to verify data freshness.
External Tools (Free)
- Microsoft Best Practice Rules for semantic models are available. See instructions for use with Tabular Editor 2:
Analysis-Services/BestPracticeRules at master · microsoft/Analysis-Services · GitHub - The app Measure Killer incorporates Best Practice Rules and helps identify unused data/measures.
- Use ALM Toolkit to compare versions of
.pbixfiles. - Use DAX Studio for performance analysis and model size.
Reports
A report template file is available in the repository:
PowerBI > template > RapportageTemplate.pbix
InSpark's conventions for reports are as follows:
Source
Reports connect to datasets published to the Power BI service via live connection.
Template
Organizations can use their own template, but it should include at least:
- Theme with company colors, fonts, etc.
- Hidden filter pane on all pages.
- Vertical slicer pane in a contrast color on the left side of the canvas.
- Card displaying last load date (Power BI + data).
See Create Power BI report templates for more details.
Filtering
- Use the filter pane for filters not controlled by report consumers.
- Enable Search for all slicers.
- Enable Select all for all slicers.
- Disable Multi-select with CTRL for all slicers.
- Sync slicers where logical for report users.
- Control visual interactions.
Layout
- Do not include company logos in reports; these can be added to the Power BI service tenant by the admin.
- Do not include report titles in reports; the title is visible in the banner in Power BI service.
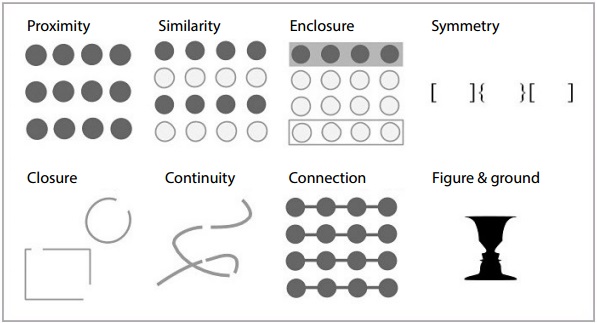
- Apply common design principles:
- Six gestalt principles
- Left top, right bottom principle

- Create a mobile view if necessary.
Visuals
- Use meaningful visual titles to provide context.
- Limit the number of visuals per page; avoid axis titles if a meaningful visual title is present.
- Prefer built-in visuals; if using custom visuals, select Microsoft certified visuals (blue/yellow tick).
- Avoid pie charts.
Colors
- Use colors only to accentuate data and draw user attention (not in headers or slicers).
- Use color saturation to show differences between high/low values.
- Use color hue for categorical data comparison.
- Prefer soft colors, for example:
#FF7070instead of#E93C0C#99FF9Einstead of#00FF0D- Use colors for common meanings:
- Red = negative
- Green = positive
- Gray = less important
Other
- Avoid bookmarks due to maintenance complexity. Use field parameters or SWITCH measures instead.
External Tools (Free)
- PBI Inspector is a rule-based Power BI report layout testing tool:
GitHub - NatVanG/PBI-Inspector: A rules-based Power BI report layout testing tool. - The app Measure Killer also incorporates Best Practice Rules and identifies unused data/measures.
Leaving the rows starting with > with the same layout as it is now